


Bitcoin is the fastest growing cryptocurrency in the world. As with most other cryptocurrencies, it goes through phases of a rise in value and devaluation over time.
What most people don’t know, however, is that this rise and fall in value often happens for very systematic reasons and with very nuanced implications.
In this article, we’ll be talking about what a bitcoin cycle is and how it impacts bitcoin’s value every time it happens. We’ll also be comparing the four bitcoin market cycles that have happened so far, and how they rank up against each other.
With that in mind, let’s get into discussing what a bitcoin cycle is and why you should know about it
What is a Bitcoin Cycle?

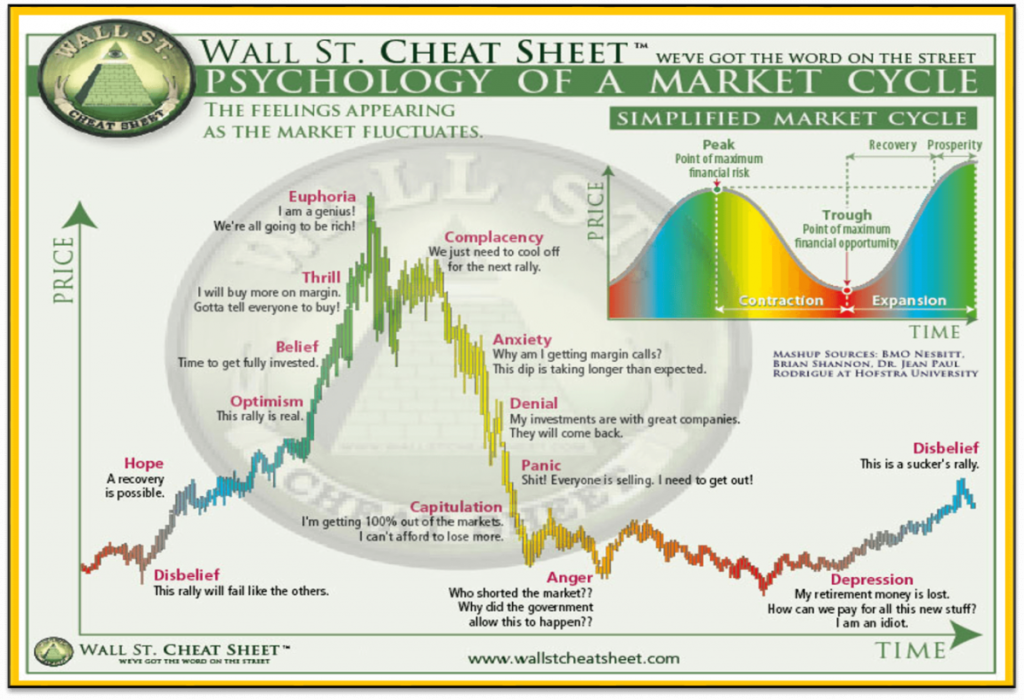
A market cycle, to put it simply, is a period when the value of a commodity increases and then decreases, or vice versa.
But perhaps even more pertinent than a variation in the prices and value of bitcoin is the amount of human emotion involved throughout the process.
The most significant of these emotions, as is apparent to anyone who takes an interest in the way investors approach the subject, are those of greed and avarice.
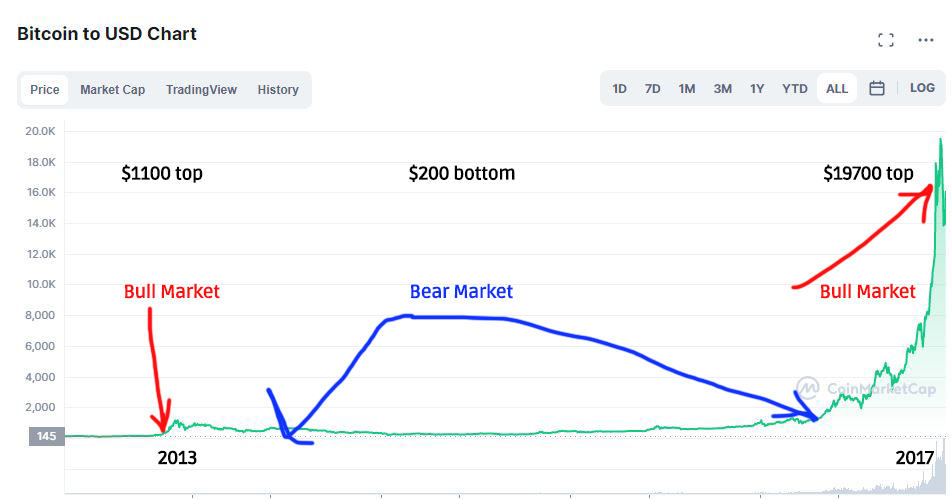
In recent times, we’ve seen that greed manifest often, most prominently when the value of bitcoin grew to around $20,000 for 1 BTC.
However, bitcoin cycles can be very unpredictable, and we’ve also observed widespread uncertainty and panic as the value of one bitcoin plummeted to $3000. If anything, these fluctuations have taught us of the undeniable importance of bitcoin cycles and how investors need to be aware of how they work.
Bitcoin Cycles – Uptrends and Downtrends
To put it simply, an uptrend in a bitcoin market cycle is a period when we tend to observe higher highs and higher lows, financially speaking.
On the contrary, a downtrend is a period where the value of the asset in question falls and does not hold as much value as it does in an uptrend or otherwise.
When it comes to bitcoin cycles, we’ve researched extensively and learned that the uptrends tend to last longer than the downtrends, which is generally a good sign. This effect is most prominent when we’re talking about how an uptrend compares to the immediately preceding downtrend.
It’s a stark reality check to investors who were caught up with thinking that a single bitcoin’s value at $20,000 would last for long. Their plans were cut short just as a downtrend happened and brought the number down to $3000.
Are Recent Bitcoin Retracings Unusual

Some of you are probably wondering if recent retracements in bitcoin’s value are uncommon or unusual, or maybe even far too much for bitcoin to consistently be viewed as a hot commodity.
Well, the answer may surprise you.
A retracement from $20,000 to $3000 is just around average when it comes to bitcoin. It may seem like a pretty big drop when you’re looking at it as an isolated case, but if you compare it with the other downtrends that we’ve seen with bitcoin, you’ll find it rather average. As a matter of fact, it has fallen by 84.5% in the most recent cycle, which is the average retracement value across the four bitcoin cycles thus far.
As it turns out, there have been four total bitcoin cycles, with the fourth one being pretty average in comparison to the last three.
We’ll be analyzing these cycles in the next section.
Bitcoin Cycles – A Brief Comparison

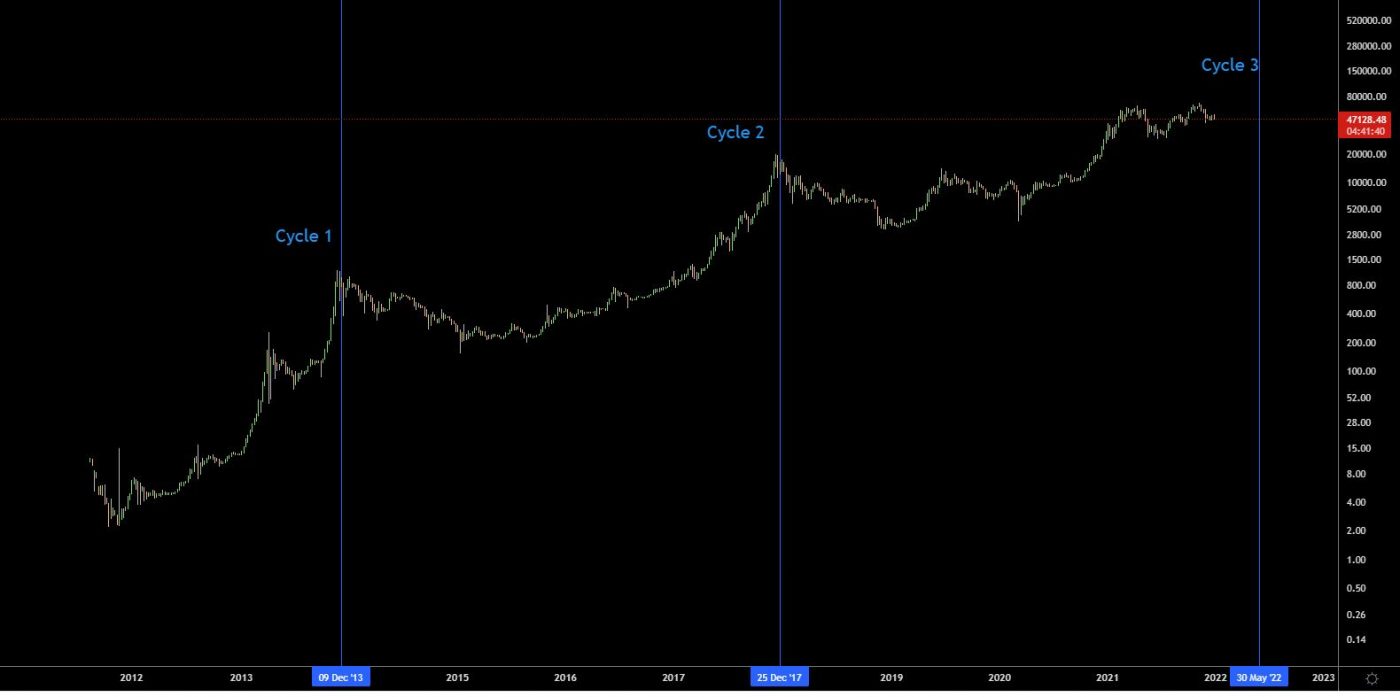
In terms of the gains that bitcoin experienced in the four different market cycles, the most prominent was the first, occurring in 2011-12 and bringing about an increase of around 312,000% in value!
After that unbelievably huge rise in value, future increases, although very substantial in their own right, have paled in comparison.
After the first market cycle, the second increase from 2012-13 stood at 13,000%, still pretty good in its own right, followed by a 2200% increase in 2013. Then, with the most recent market cycle, the value increased by 11,000%, which sits at the third spot amongst the increases.
If we compare the downtrends, they’ve been rather consistent. Still, we’ve observed certain fluctuations with the percentages in question.
For instance, the retraces for the four market cycles so far look something like this: -93%, -80%, -86%, -84.5%.
The current trend is pretty average, both with the uptrend and the downtrend, so experts have determined that the current bitcoin cycle is average in terms of both positive and negative value shifts.
The Human Influence On Bitcoin Cycles

Bitcoin cycles may be understood as highly impressionable mechanisms that are impacted very heavily by how investors react to the changes in bitcoin’s value.
For instance, when bitcoin’s value falls and investors flock towards buying bitcoins at cheaper rates, the increased demand and low supply (due to bitcoin halving and several other reasons) then drives their value up again, initiating the next uptrend in the bitcoin cycle.
Fear & Greed

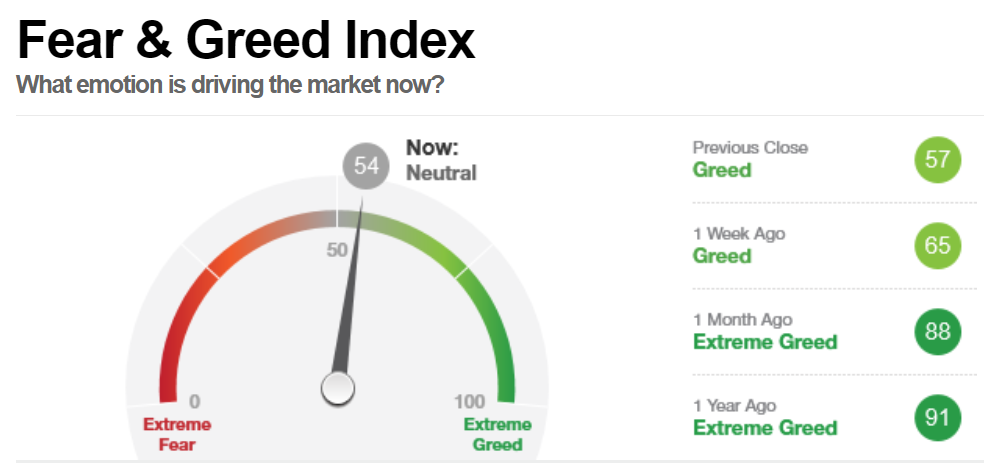
Understandably, greed has a lot to do with investors flocking towards investing and then triggering large changes in bitcoin’s value over time.
All in all, one thing is certain: bitcoin cycles can be very unpredictable and may even produce results that we haven’t yet calculated or accounted for. We encourage people to be very careful when they’re looking to invest during an uptrend or a downtrend and thoroughly analyze the market from a variety of standpoints.
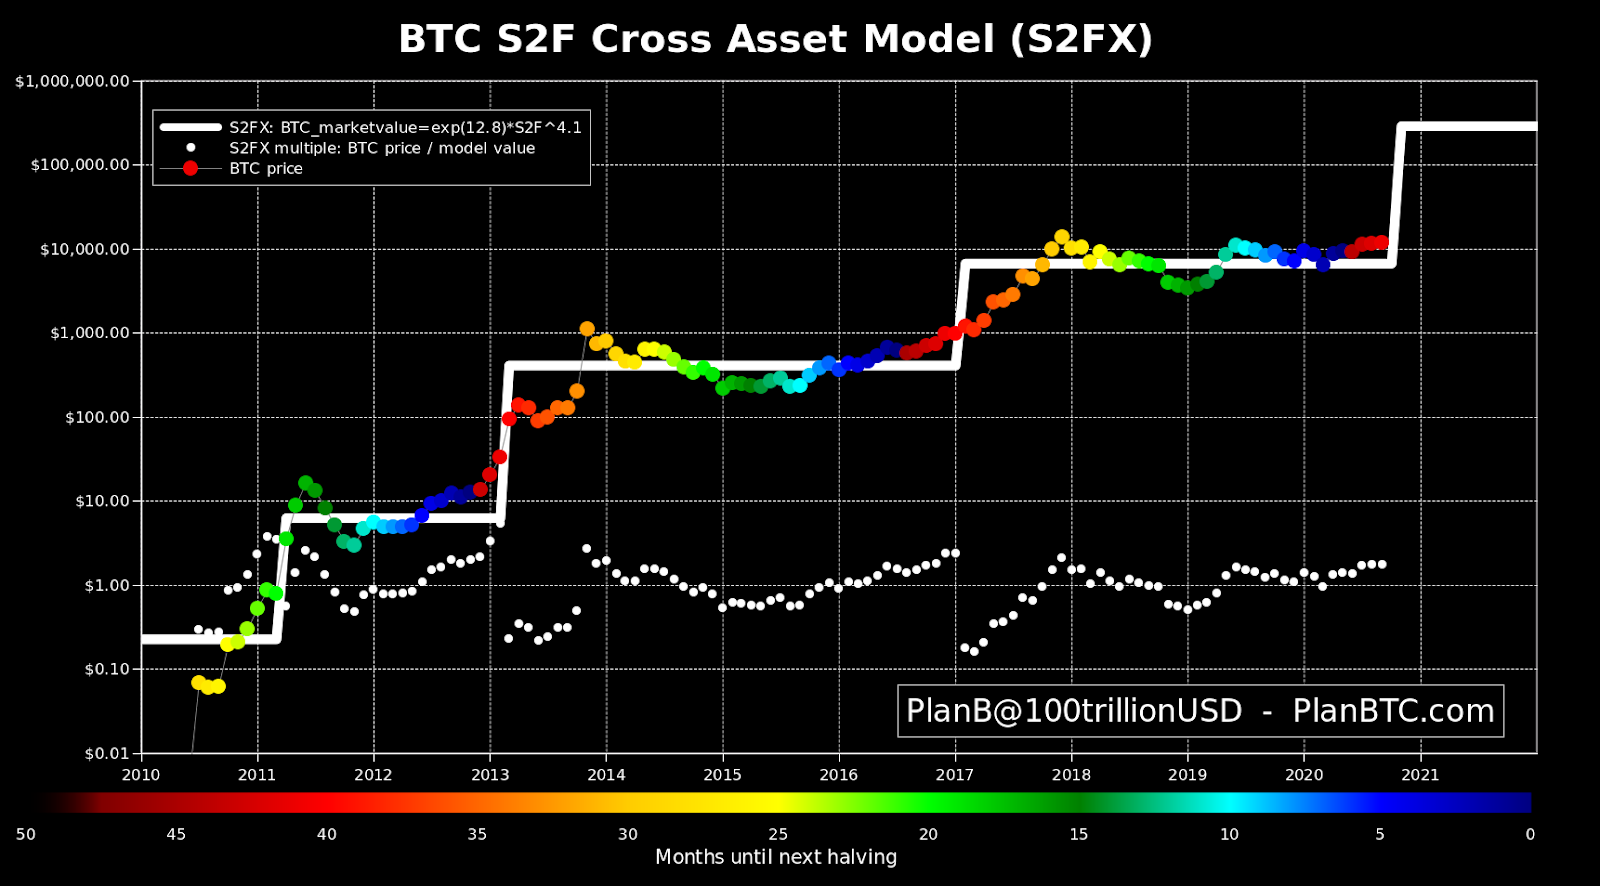
Bitcoin’s Cycles Or Are They Liquidity Cycles Of Printing Money For The Business Cycle
At its core, the Bitcoin market cycle isn’t random — it’s a long-term pattern of price rises and falls that has repeated roughly every four years throughout Bitcoin’s history:
- Accumulation
- Expansion/Bull market
- Peak (often exuberant price levels)
- Crash and Bear Market
- Recovery / back to accumulation
This cycle reflects supply shocks, human psychology, and broader financial conditions.
A major structural cause behind the repeated rhythm is Bitcoin’s halving — a built-in mechanism that cuts the new supply of Bitcoin entering the market in half about every four years. The halving tends to tighten supply if demand stays steady or grows, which historically set the stage for bull markets following each event.
💸 Liquidity and the Broader Economy
Bitcoin doesn’t exist in a vacuum — its price behavior also reflects global money and credit conditions:
📍 Liquidity Drives Risk Asset Cycles
Across financial markets, when governments and central banks print money or inject liquidity (via tools like quantitative easing), risk assets — stocks, crypto, commodities — tend to rise. That’s because more money in the system lowers interest rates and pushes investors toward higher-yielding assets.
Bitcoin has historically moved with global liquidity — a study found it tracks shifts in global money supply more closely, over 12-month periods, than many traditional assets. When global liquidity expands, Bitcoin’s price tends to rise; when liquidity tightens, Bitcoin often falls or stagnates.
This strongly ties Bitcoin’s cycle to the business and monetary cycles of central banks:
- During tightening (higher rates, less money creation), risk assets struggle.
- During easing (more printed/ injected liquidity), risk asset rallies often accelerate.
🧠 Is the Bitcoin Cycle Over or Just Different?
There are a few ways to think about whether a cycle might be “over”:
🟡 1. The Traditional Bitcoin Cycle Framework
Historically, post-halving bull runs gain steam roughly 6–18 months after the event, then peak and collapse before the next halving. The most recent halving was in April 2024, so some models expect the major move to peak sometime in 2025–2026 rather than already being finished.
🟡 2. Liquidity Conditions Matter More Than Ever
If global monetary conditions are tightening — meaning central banks reduce liquidity via things like quantitative tightening (selling assets and reducing money supply) — the environment supporting risk assets gets weaker. A sharp drop in liquidity can cut short or flatten cycles because there’s simply less money hunting for yields.
So if the cycle feels over, it might be because broad liquidity is tightening or risk appetite is fading, not because Bitcoin’s fundamental halving cycle has broken.
🟡 3. Structural Market Evolution
Markets aren’t the same today as in 2017 or 2021:
- More institutional involvement
- Spot Bitcoin ETFs
- Derivatives and sophisticated hedging
These all smooth volatility and extend time horizons, potentially stretching or altering ‘the cycle’ shape compared to the past.
This means that even if the classic cycle peaks look different (less dramatic, slower, or delayed), that doesn’t necessarily mean Bitcoin’s rhythm is dead — just that it’s interacting with a much deeper, more complex financial ecosystem.
📉 Liquidity + Cycles = Macro Reality Check
If the world is entering a phase of reduced global liquidity — higher rates, tighter credit, less central bank printing — then the overall environment for risk assets including Bitcoin changes:
🔹 Lower liquidity -> less capital chasing assets -> weaker bull runs
🔹 Tighter credit conditions -> reduced leverage -> slower price momentum
🔹 Higher reward for safe assets -> less incentive to take risk in crypto
This fits a broader view that markets follow something like a business/credit cycle — expansion, euphoria, contraction — because money supply cycles drive sentiment and investment flows.
That’s why some analysts tie Bitcoin’s price cycles to liquidity cycles more than just halving schedules. In that sense, a major liquidity contraction could feel like the cycle is over even if the halving clock hasn’t fully played out.
⚡ Bottom Line
✅ Bitcoin cycles still exist, rooted in halving and investor psychology.
✅ Liquidity conditions shape how big and long these cycles are.
✅ A cycle can feel over if broad liquidity dries up — even if the technical halving conditions haven’t fully played out.
✅ Changes in markets and institutional behavior mean current and future cycles might not look like 2017 or 2021.
Wrapping it Up
We hope that by now, you have a much better understanding of what bitcoin cycles are, how they occur, what uptrends and downtrends are, what recent bitcoin cycles have looked like, and more.
It’s very interesting to keep track of the various factors that come into play when we’re analyzing how bitcoin’s value rises or falls. It’s equally interesting to study factors that accelerate these uptrends and downtrends. Moreover, we can learn a lot from looking at all the bitcoin market cycles as a “big picture” comparative and then drawing conclusions.
Hopefully, this article helped you in more ways than one. Happy investing!


